
Audits & planning
How to Lower Your Energy Bill: No-Cost, Low-Cost and Big Upgrades
Ways to lower your energy bill, ranked from free habit changes to low-cost fixes and big upgrades, with official savings figures and where to find help.
Topics
Devices that look off often still draw power around the clock. Enter how many you have and their average standby watts to see the yearly kWh and dollar cost.
Updated · Free, private: nothing you type leaves your browser.
Your results
25 devices drawing 2 W each add up to 438 kWh and about $79 a year, even when you are not using them.
Estimate only. Uses the assumptions explained below.
| Yearly standby cost | |
|---|---|
| Your devices (2 W each) | $79 |
| After cutting 50% | $39 |
| If each used 0.5 W | $20 |
| Year | Running total |
|---|---|
| 0 | -$0 |
| 1 | $39 |
| 2 | $79 |
| 3 | $118 |
| 4 | $158 |
| 5 | $197 |
| 6 | $237 |
| 7 | $276 |
| 8 | $315 |
| 9 | $355 |
| 10 | $394 |
| Year | Energy savings | Net cash flow | Running total |
|---|---|---|---|
| 0 (Up-front cost) | — | -$0 | -$0 |
| 1 | $39 | $39 | $39 |
| 2 | $39 | $39 | $79 |
| 3 | $39 | $39 | $118 |
| 4 | $39 | $39 | $158 |
| 5 | $39 | $39 | $197 |
| 6 | $39 | $39 | $237 |
| 7 | $39 | $39 | $276 |
| 8 | $39 | $39 | $315 |
| 9 | $39 | $39 | $355 |
| 10 | $39 | $39 | $394 |
| Total | $394 | $394 | $394 |
Save up to 3 scenarios (for example, with and without a rebate) and compare them side by side.
Phantom load, also called standby power or “vampire” power, is electricity used by devices that are switched off or not doing their main job. A TV waiting for its remote, a phone charger with nothing attached, a microwave clock and a router all count. Each one is small, but they run 24 hours a day, 365 days a year, so they add up.
The calculator adds up the always-on wattage of your devices, turns it into kilowatt-hours (kWh) for a full year, and multiplies by your electricity price.
Total standby watts = number of devices × average standby watts per device
kWh per year        = total standby watts × 8,760 hours ÷ 1,000
Cost per year       = kWh per year × electricity price ($/kWh)
There are 8,760 hours in a 365-day year. Dividing by 1,000 turns watt-hours into kWh, the unit on your bill. Berkeley Lab gives the same rule in round numbers: one watt running all year is about 9 kWh.
The default electricity price is $0.18 per kWh, based on the US average residential price of 18.31 cents per kWh in July 2026 (EIA Electric Power Monthly, Table 5.6.A). Replace it with your own rate.
The main assumption is that every device draws the same average standby power all year. In real homes a few devices draw most of the standby power, and some switch between low-power modes.
The default inputs describe a home with 25 plugged-in devices averaging 2 watts each, at $0.18 per kWh.
That is money spent on devices you are not actively using.
Say a California household has 40 newer devices on standby, averaging 1 watt each, and pays $0.34 per kWh. California’s average residential price was 33.61 cents per kWh in July 2026 (EIA, Table 5.6.A). The calculator returns a 40.0-watt load, 350 kWh a year and about $119 a year. Fewer watts per device, but a much higher rate, means a bigger bill.
Now try the low end: 25 devices at 0.5 watts each, the level Berkeley Lab says most products are now under, at $0.18 per kWh. The result is 12.5 watts, 110 kWh and about $20 a year. That gap shows why your measured wattage matters more than the device count.
Treat the result as a size check, not an exact bill line.
To see what a single appliance costs when it is actually running, use the appliance energy cost calculator. To see how standby fits into a whole monthly bill, try the electric bill calculator.
Use this table to sanity-check the “average watts per device” you enter. The ranges come from Berkeley Lab’s descriptions, not from lab tests of specific models.
| Situation | Standby per device | 25 devices, kWh per year | 25 devices, cost at $0.18/kWh |
|---|---|---|---|
| Mostly new products (Berkeley Lab: most under 0.5 W) | 0.5 W | 110 kWh | about $20 |
| Mix of new and older products | 2 W (calculator default) | 438 kWh | about $79 |
| Older products (typical 1–3 W about 20 years ago) | 3 W | 657 kWh | about $118 |
The kWh figures follow the formula above. Your real home will be a mix. One device drawing 15 watts adds more than 30 devices drawing half a watt.
Your electricity rate. This is the biggest swing factor. In July 2026, average residential prices ranged from about 12.72 cents per kWh in Louisiana to 48.00 cents in Hawaii (EIA, Table 5.6.A). The same 50-watt standby load costs about three to four times more in Hawaii than in Louisiana.
Time-of-use rates. If your utility charges more at certain hours, standby power is billed at every rate, because it never stops. Use your average all-in price per kWh: total bill divided by kWh used.
How many devices you own. Berkeley Lab notes that standby per product has fallen, but the number of products with standby has grown. A home with smart speakers, smart plugs, security cameras and several chargers can have many small loads.
Programs and help. There is no federal rebate for power strips or watt meters. Some utilities give away or lend energy-saving kits, and some public libraries lend watt meters. Ask your utility. If high bills are a strain, see our guide to help paying energy bills.
This tool uses one average standby wattage for all devices. It does not model devices that switch between sleep, network standby and off modes, or loads that change with the season. It assumes the device stays plugged in all 8,760 hours of the year and uses a single flat electricity price.
A home energy audit can find always-on loads you would not think to count, such as pumps, heaters and old appliances. This calculator gives an educational estimate, not a quote, a measurement or advice for your home. Measured watts and your own bill are always better than defaults.
It depends on how many devices you have and how much each one draws. Lawrence Berkeley National Laboratory estimates that standby power adds up to about 5 to 10 percent of residential electricity use. For a home using about 899 kWh a month, the EIA average for 2022, that would be roughly 45 to 90 kWh a month. At the July 2026 US average residential price of 18.31 cents per kWh, that is roughly $8 to $16 a month, but your own number can be higher or lower.
Most modern products draw very little: Berkeley Lab says most draw less than 0.5 watts on standby, down from typical values of 1 to 3 watts about twenty years ago. A few items draw much more, such as some set-top boxes, game consoles left in instant-on modes, older audio gear and devices with warm-up features. That is why measuring the few big ones with a plug-in meter is more useful than guessing an average for everything.
Multiply its standby watts by about 9 to get kWh per year, then multiply by your price per kWh. One watt running all year is 8.76 kWh, which Berkeley Lab rounds to 9 kWh. So a device drawing 5 watts uses about 44 kWh a year. At 18 cents per kWh that is about $8 a year. This calculator does the same math for many devices at once.
Usually not everything. Unplugging tiny loads saves very little and can reset clocks, settings and updates. Berkeley Lab suggests targeting older devices you rarely use, seasonal equipment, empty chargers and entire entertainment centers you can switch off with one power strip. It notes that an informed, aggressive approach can cut standby use by about 20 percent. Bigger savings usually come from heating, cooling and water heating.
They can, if they cut power to a whole group of devices you do not use for long stretches, such as a TV, sound bar and console. A switchable strip does the same job if you remember to flip it. Leave internet routers, medical devices, security systems, refrigerators and anything that needs to stay on alone. Check what each device does before cutting power to it.
The calculator multiplies a single average wattage by the number of devices, so a few power-hungry items can be missed. Some always-on loads are not obvious: well pumps, hot water recirculation pumps, aquarium heaters, pool equipment, older furnace controls and heated toilet seats. Your utility may also charge more than the default rate once fixed fees and taxes are included. Measure the largest items and use your all-in price per kWh.
This calculator gives educational estimates, not quotes, tax advice or an eligibility decision. Results depend on the inputs and assumptions shown above. How we research
Ways to lower your energy bill, ranked from free habit changes to low-cost fixes and big upgrades, with official savings figures and where to find help.
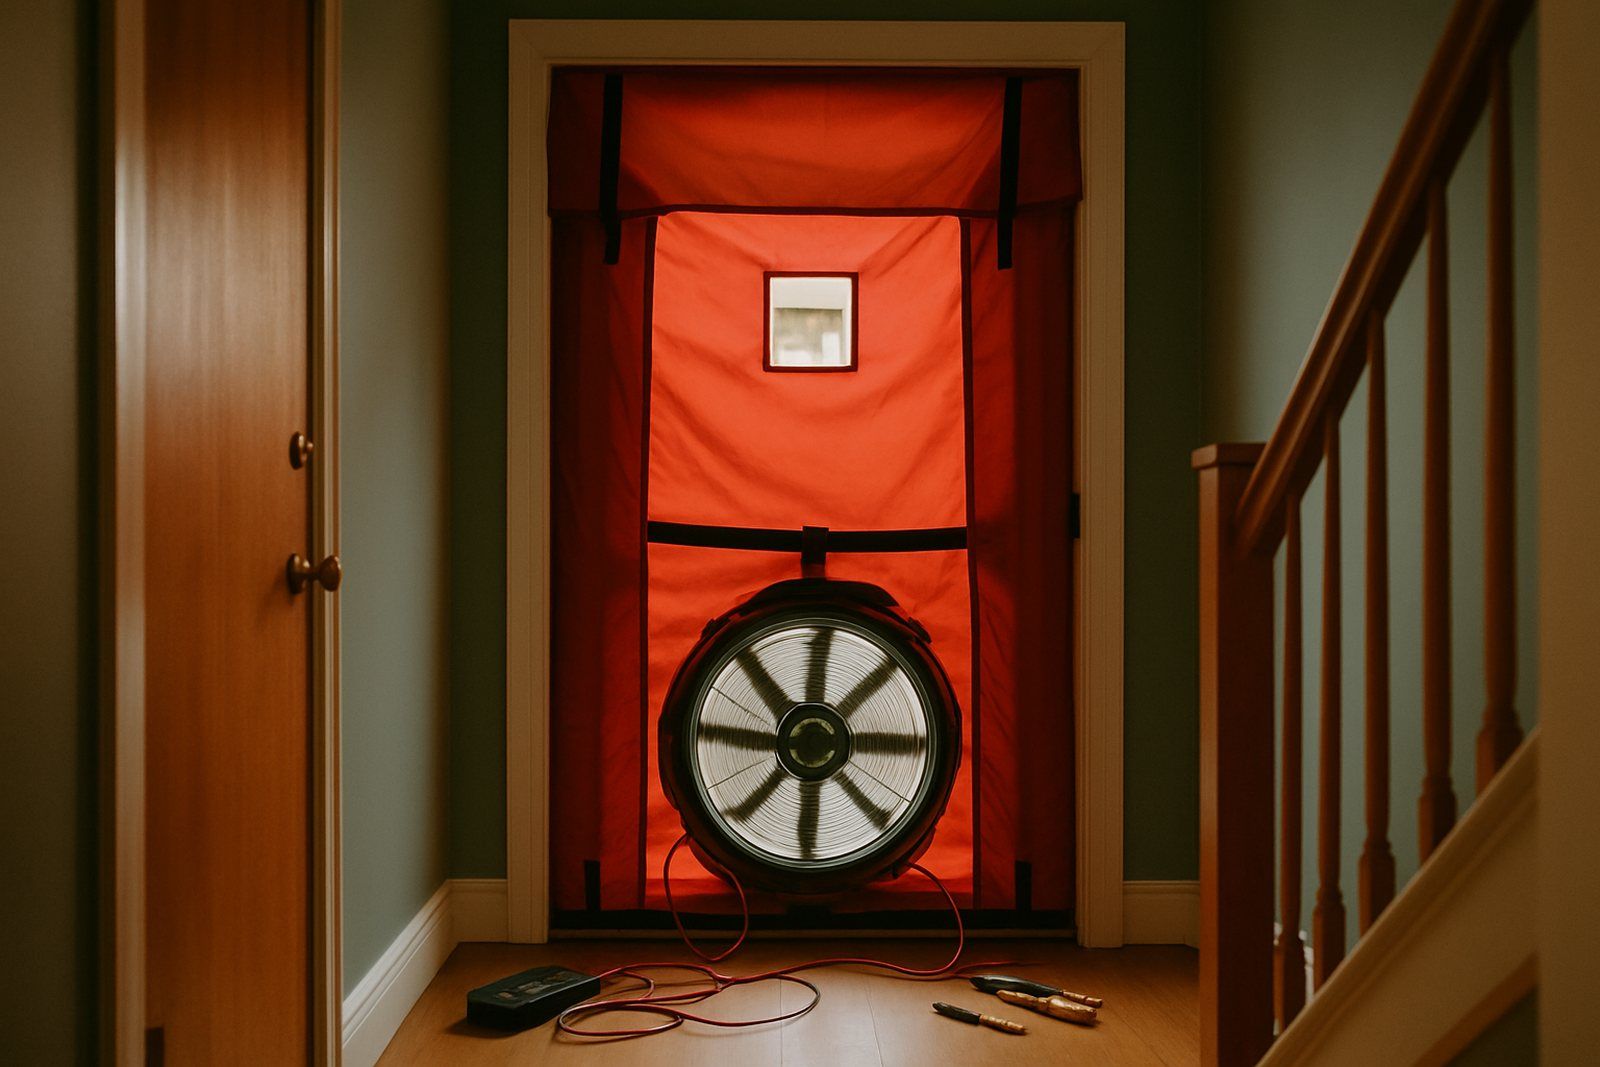
What a home energy audit includes, what it costs, how to find a BPI or RESNET certified pro, free utility audits, and a DIY checklist you can do today.